"The Right to Vote" (1947) by Norman Rockwell
Markets vs. Polls: Forecasting the 2024 U.S. Presidential Election
Sebastian Brookes and Shiven Mishra
April 21, 2026
1. Introduction
Goal of the Project
This project evaluates whether prediction markets or traditional polling averages were more accurate in forecasting state-level outcomes of the 2024 U.S. presidential election.
Problem Statement & Background
Election forecasting shapes campaign strategy, media coverage, and public expectations. Two dominant methods exist: polling aggregation, which synthesizes survey data into candidate support estimates, and prediction markets, which let participants trade contracts on election outcomes to produce real-time probability estimates. The 2024 presidential race - featuring a withdrawal, an assassination attempt, and a late candidate substitution - provides a uniquely chaotic testing ground for comparing these approaches.
We compare Polymarket, a prediction market offering state-level contracts, against FiveThirtyEight's polling averages, the most widely cited poll aggregator. Using certified Federal Election Commission results as ground truth, we assess which source made more accurate state-level winner calls and which responded more faithfully to five major campaign events. Understanding these relative strengths matters for campaigns allocating resources on forecast signals, journalists choosing which indicators to amplify, and policymakers evaluating prediction markets under active regulatory debate.
2. Dataset
Dataset Overview
Polymarket state-level contracts. Daily win-probability estimates for Trump and Harris across all 50 states and D.C., covering March 29 through November 4, 2024 (10,850 rows). Obtained via a Kaggle archive of Polymarket's public API.
FiveThirtyEight polling averages. State-level vote-share estimates derived from aggregated polls, March 1 through September 12, 2024 (~3,500 rows). Obtained from FiveThirtyEight's public GitHub repository.
FEC certified results. Official vote totals and electoral-vote allocations for all 50 states and D.C. (51 rows). Obtained directly from fec.gov.
Campaign events timeline. A manually curated list of 15 major campaign events with dates, expected directional effects, and affected candidates. Compiled from U.S. News.
Data Collection & Ethics
All data is publicly available and contains no personally identifiable information. Potential biases should be acknowledged: Polymarket's user base skews toward cryptocurrency-engaged, younger, and male demographics, which may introduce systematic lean. FiveThirtyEight's aggregation inherits nonresponse bias, herding effects, and house-effect adjustments from constituent polls. Our analysis measures accuracy against certified results rather than claiming either source is unbiased.
Key Variables
| Variable | Description | Type | Example |
|---|---|---|---|
| trump_prob | Polymarket implied win probability for Trump | Numeric (0-1) | 0.58 |
| trump_pct | 538 polling average vote share for Trump | Numeric (%) | 48.3 |
| dem_pct | 538 polling average vote share for Democrat | Numeric (%) | 47.1 |
| winner | FEC certified winner of each state | Categorical | Trump / Harris |
| is_swing | Whether state is a battleground | Boolean | True / False |
3. Methods
Data Preprocessing
Polymarket's raw data arrived as 150 separate CSV files (50 states across three time periods), which were consolidated into unified datasets with duplicate same-date entries resolved by retaining the latest timestamp. FiveThirtyEight's raw file contained both 2020 and 2024 cycle data in long format; we filtered to 2024, pivoted to wide format, and merged Biden and Harris into a single Democratic column to maintain continuity across Biden's July 21 withdrawal. Because FiveThirtyEight updates irregularly, we applied forward-fill interpolation to produce daily values for each state.
Exploratory Data Analysis
The two sources have asymmetric coverage: Polymarket provides daily data through November 4 for all 50 states, while FiveThirtyEight ends September 12 and covers only 13 states with sufficient polling. This overlap constraint - 13 states from March 8 to September 12 - defines the fair comparison boundary. All seven swing states (AZ, GA, MI, NV, NC, PA, WI) are included in the overlap.
Analysis Approach
Winner-call accuracy. For each source and state-date pair, we derived a binary winner prediction: Polymarket predicts Trump when his probability exceeds 0.5; FiveThirtyEight predicts Trump when his polling average exceeds the Democrat's. Accuracy is the fraction of correct state calls against certified FEC winners.
Electoral-vote projection. We mapped state-level predictions to electoral votes using the 2024 apportionment, producing implied Electoral College totals for comparison against the certified result (Trump 312, Harris 226).
Statistical testing. McNemar's exact test was applied to paired state predictions on September 12 to assess whether the accuracy difference between sources was statistically significant.
Event-response analysis. For five major events, we computed swing-state average Trump lead in three windows: baseline (days -3 to -1), immediate (days 0 to +1), and settled (days +2 to +7). The baseline-to-settled shift captures each event's net effect. Shifts were z-scored by each source's daily volatility to enable cross-source comparison.
4. Results & Conclusions
Key Findings
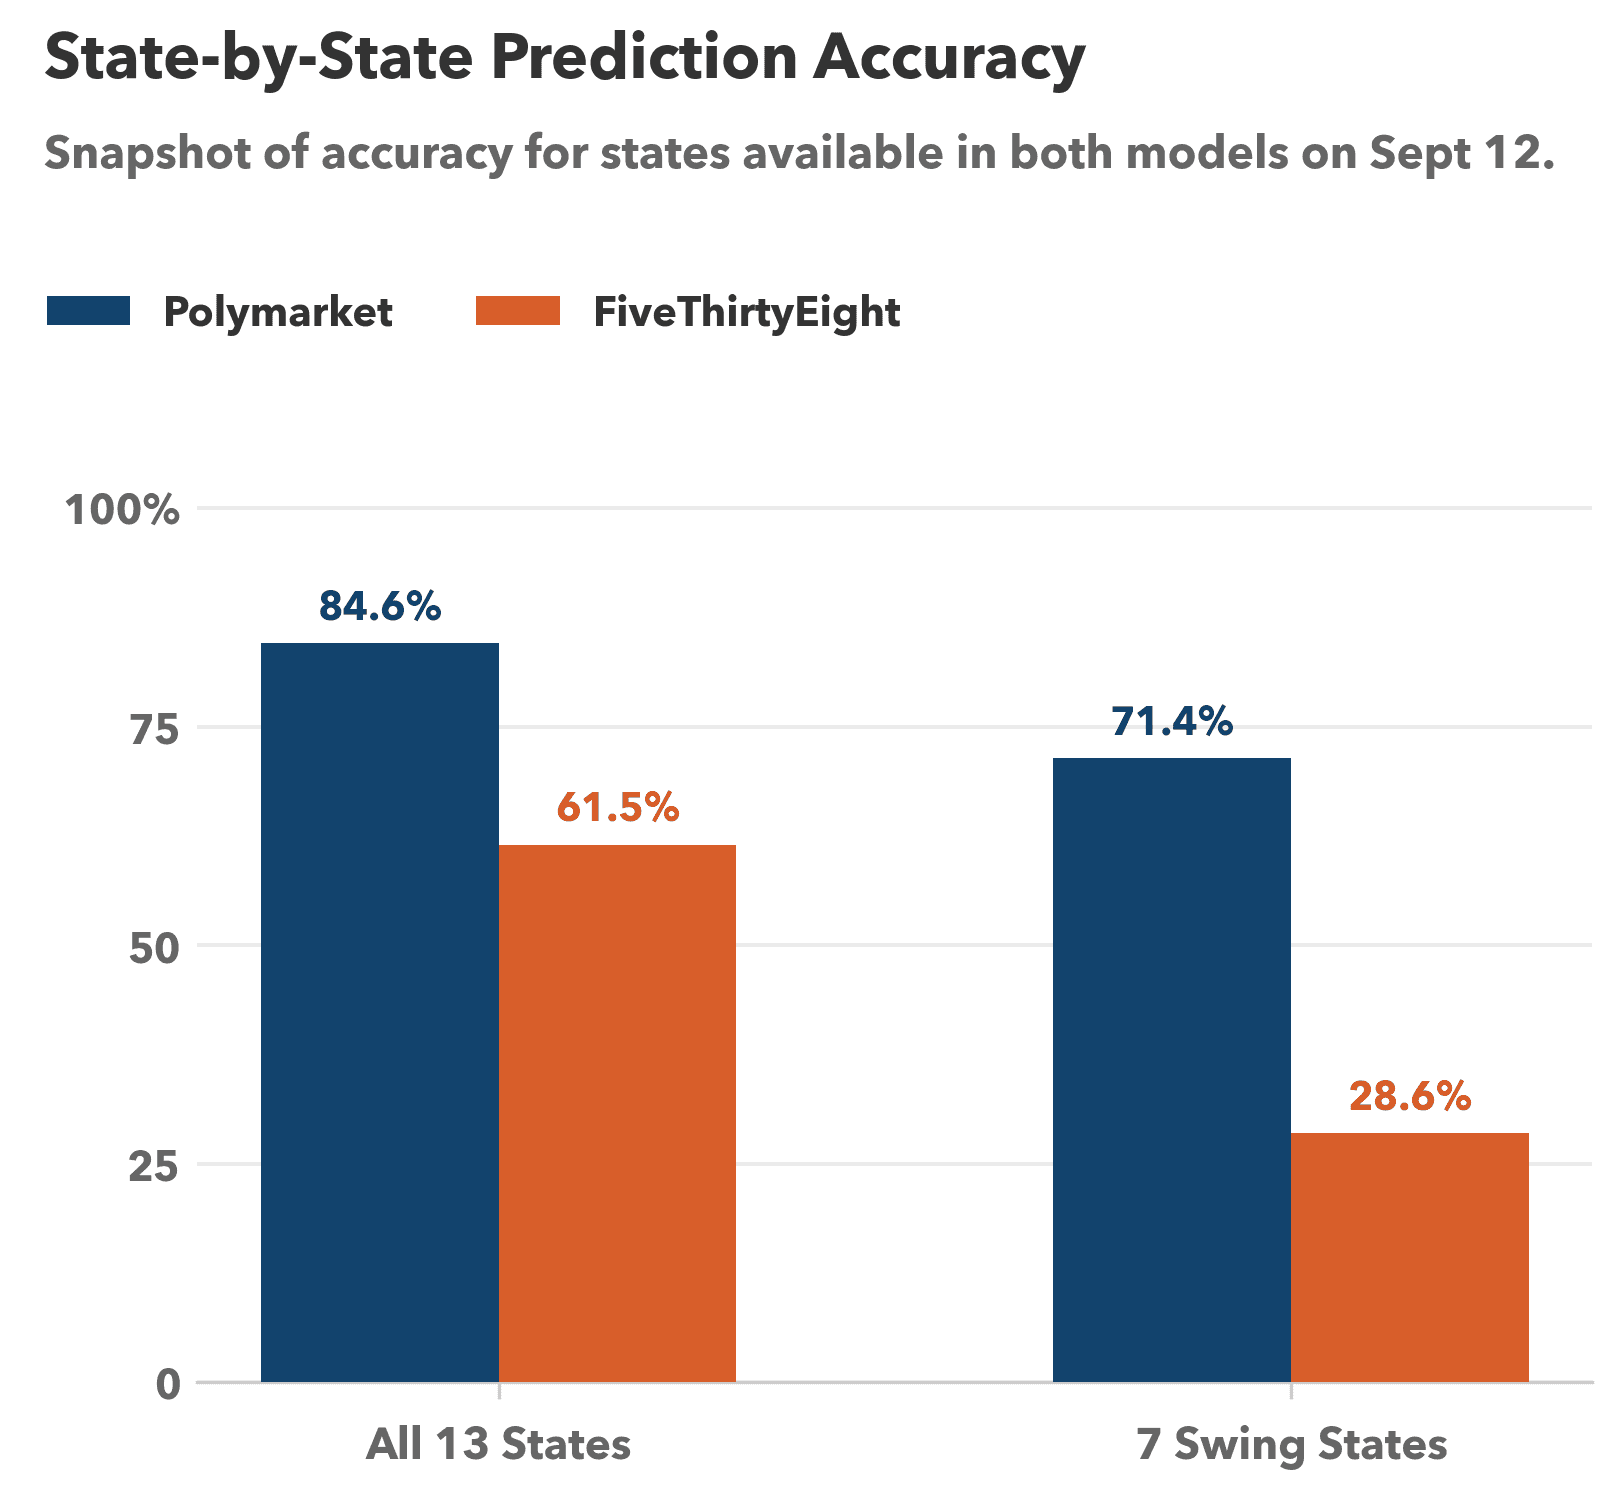
Finding 1: Polymarket outperformed FiveThirtyEight on the final overlap date. On September 12, 2024, Polymarket correctly called 11 of 13 overlap states (84.6%) compared to FiveThirtyEight's 8 of 13 (61.5%). In swing states, Polymarket went 5 for 7 (71.4%) while FiveThirtyEight managed 2 for 7 (28.6%). The three conflicting states -- North Carolina, Nevada, and Pennsylvania -- were all decided by narrow margins favoring Trump. Both sources missed Michigan and Wisconsin, where Trump won by under one point.
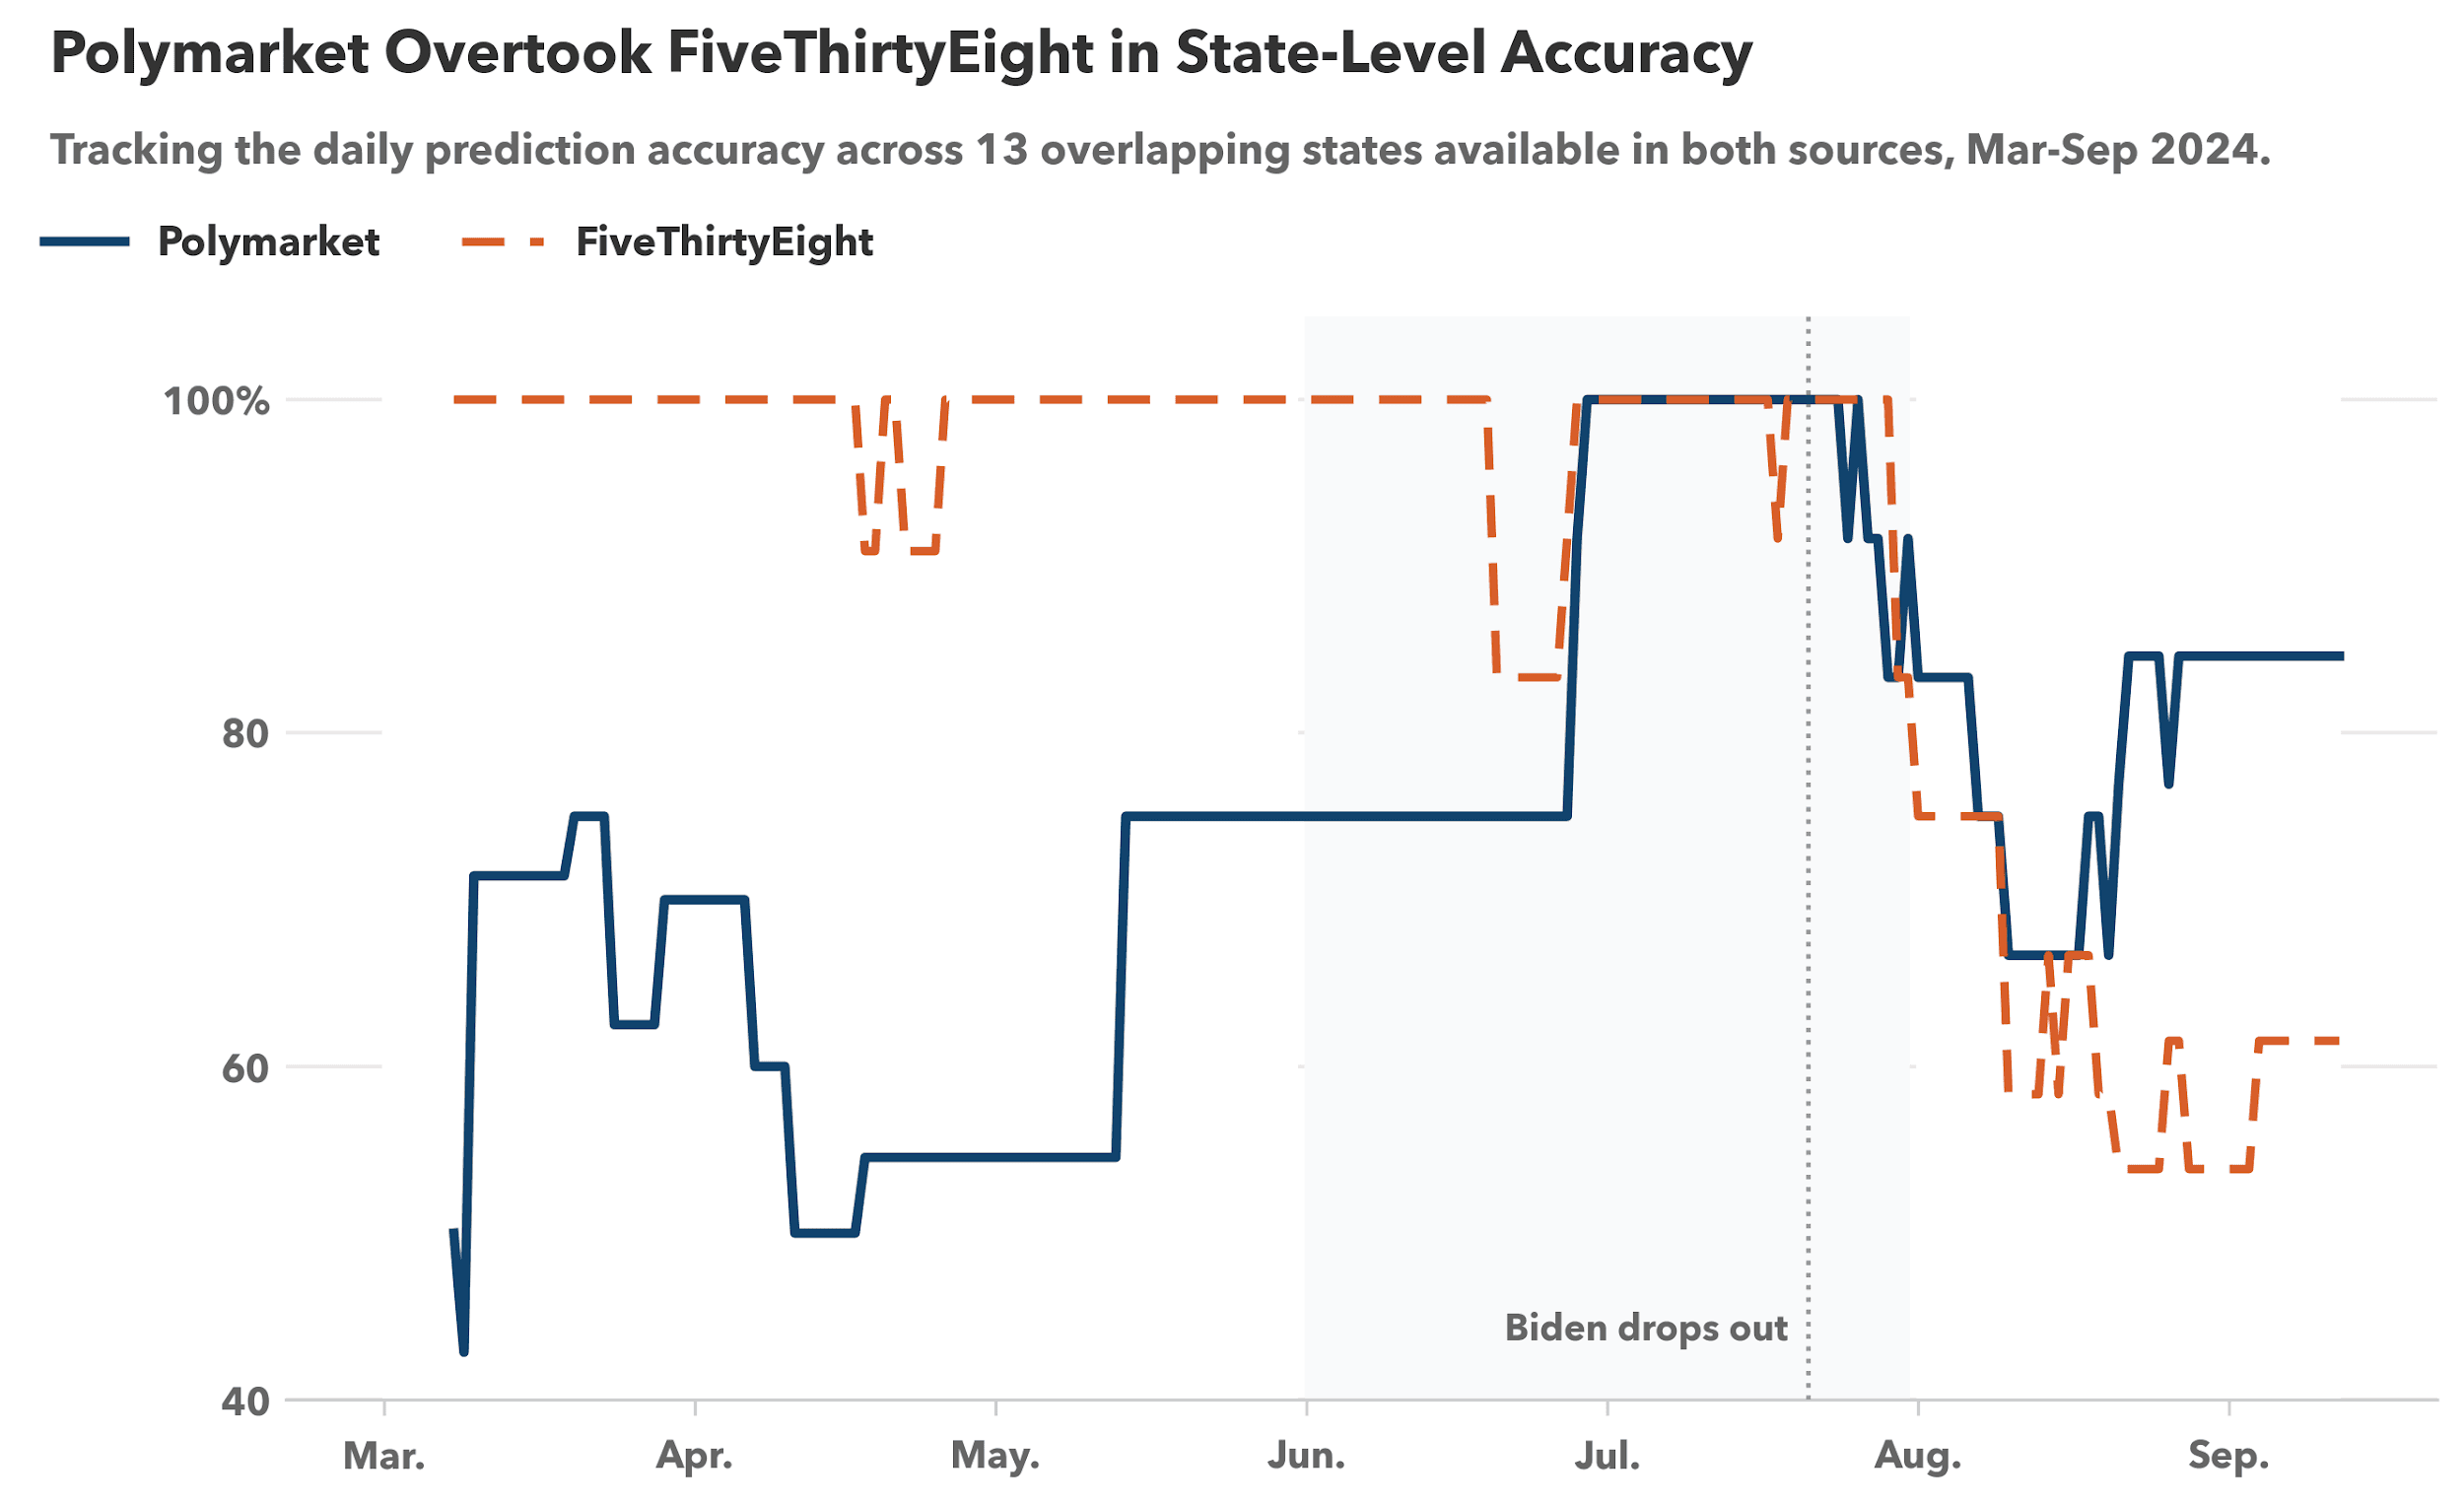
Finding 2: The two sources exhibited a crossover pattern over time. During the stable early period (March-May), FiveThirtyEight averaged 99.4% daily accuracy versus Polymarket's 63.6%. After Biden's July 21 withdrawal, the relationship reversed: from August 1 through September 12, Polymarket averaged 79.2% while FiveThirtyEight fell to 62.2%. This suggests polls are more reliable in stable environments, while markets adapt faster when fundamentals shift.
Finding 3: Polymarket's implied Electoral College projection was directionally correct. Mapping state predictions to electoral votes on September 12, Polymarket implied a Trump-leaning outcome, closer to the certified result of Trump 312 to Harris 226. FiveThirtyEight implied a Harris-leaning outcome, getting the overall direction wrong. As Polymarket continued past September 12, its accuracy rose to 94% by October 6 and 96% by November 4.
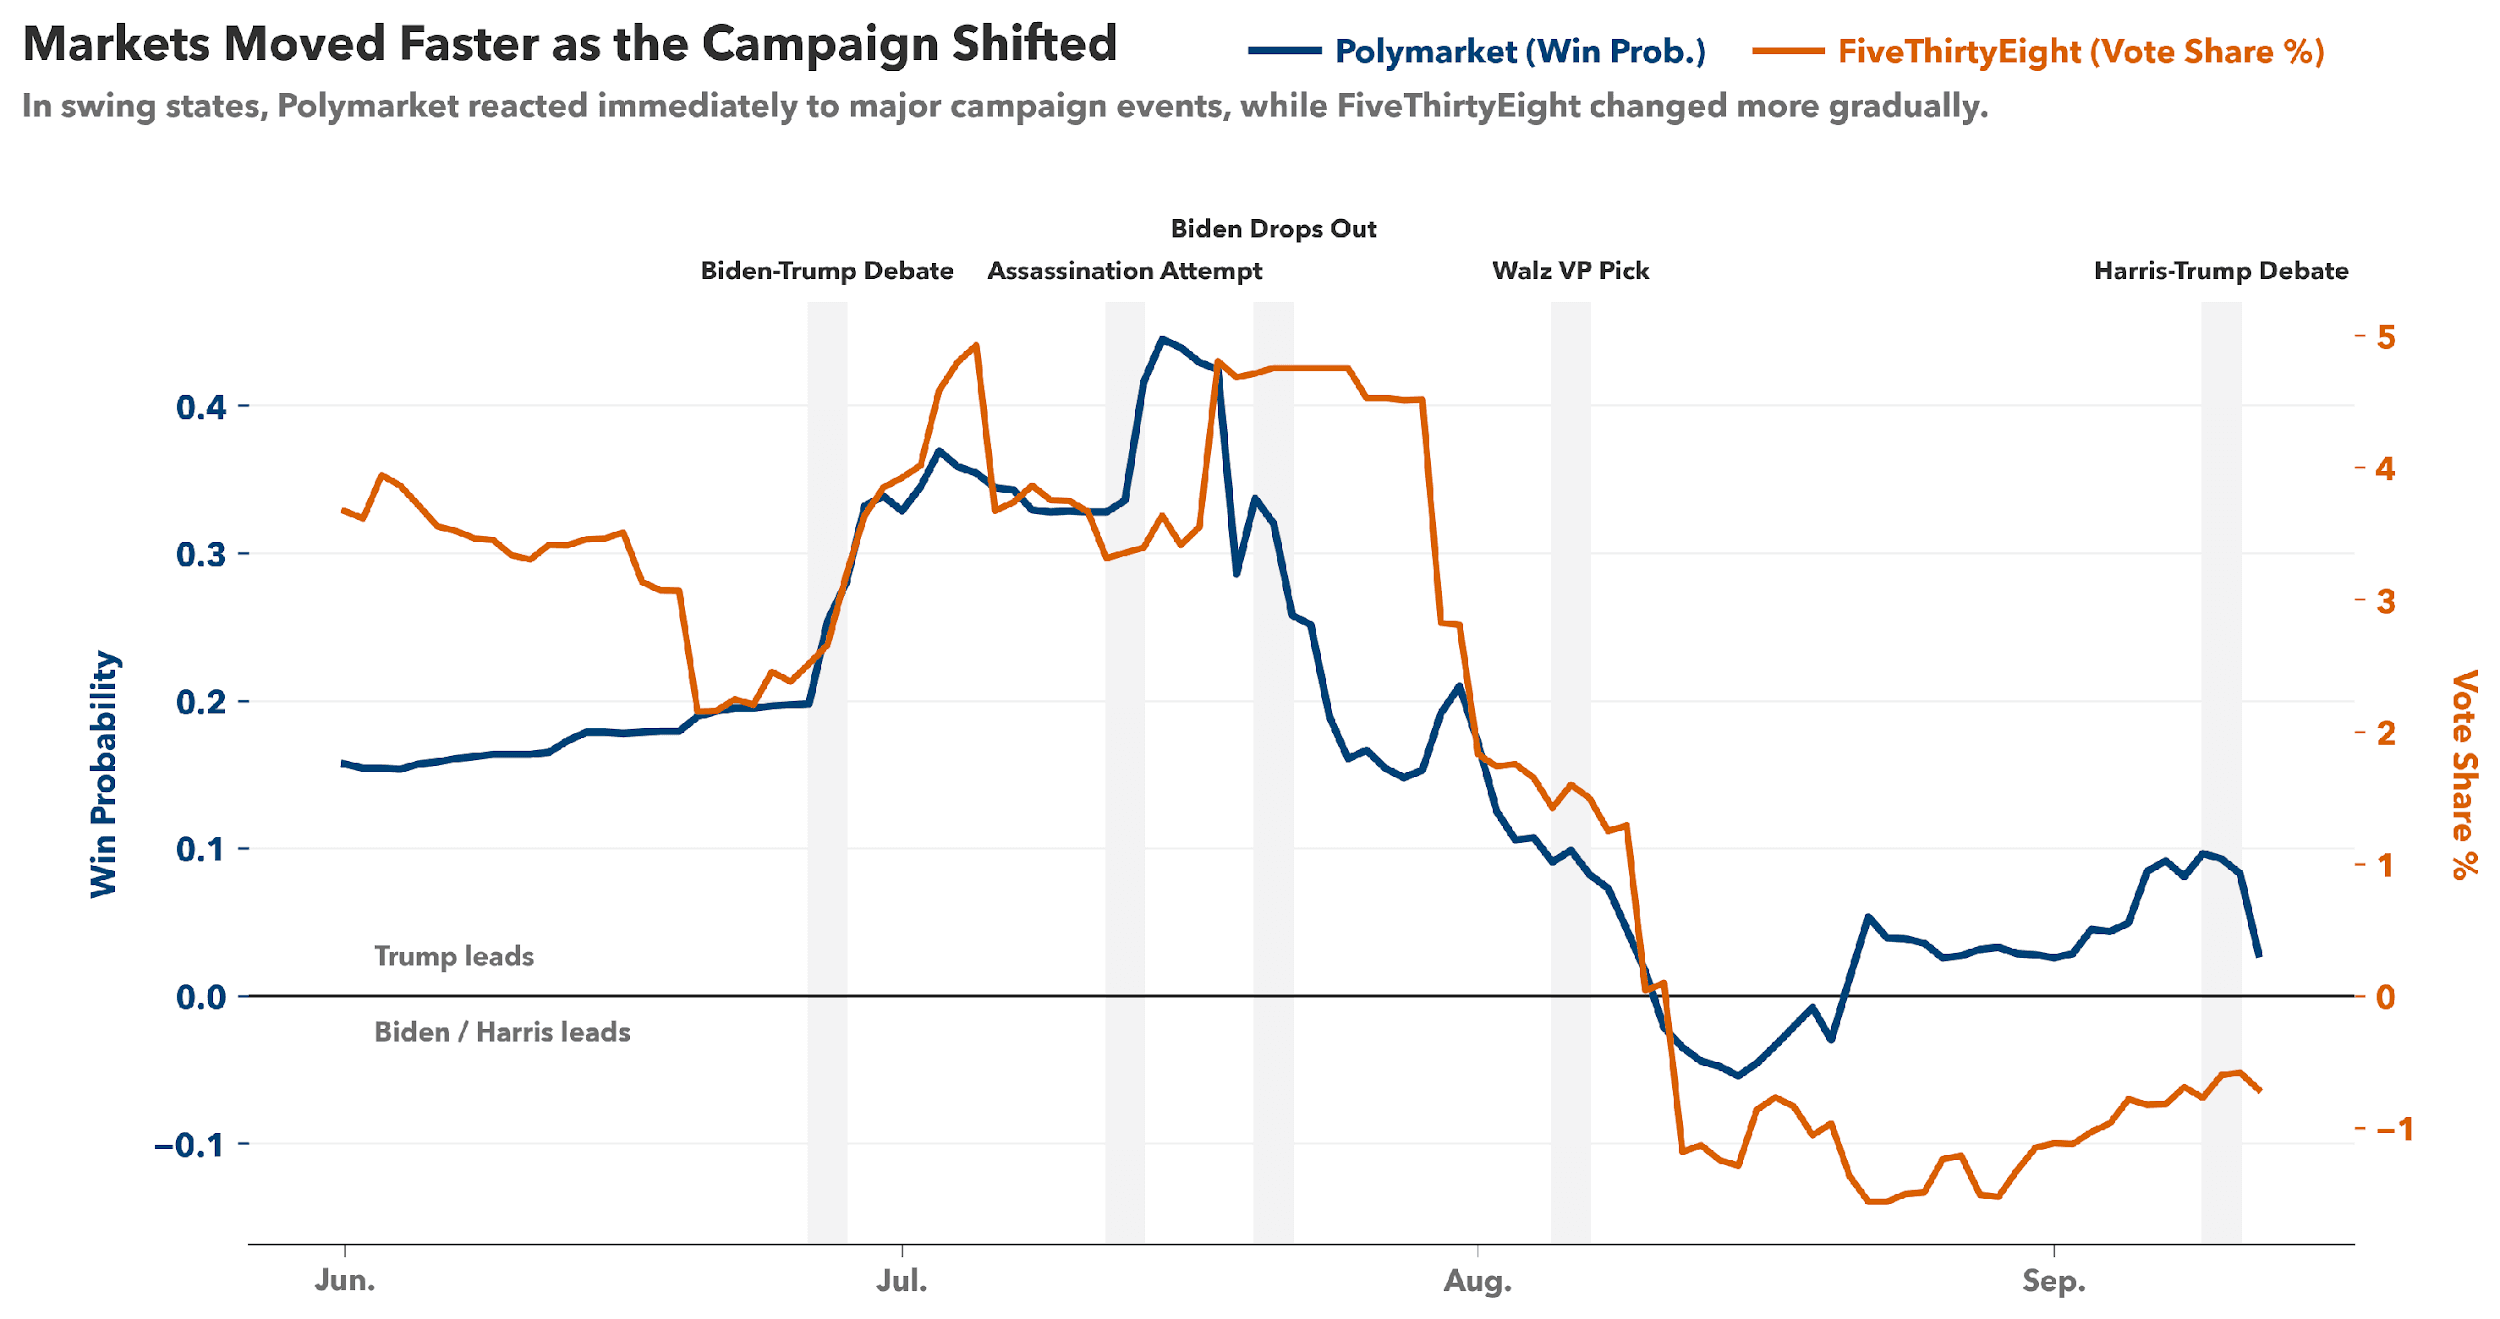
Finding 4: Markets responded faster and more accurately to major campaign events. Across five major events -- the Biden-Trump debate, Trump assassination attempt, Biden's dropout, Walz's VP selection, and the Harris-Trump debate -- Polymarket moved in the expected direction in 4 of 5 cases; FiveThirtyEight agreed in 3 of 4 measurable cases. Critically, Polymarket repriced within hours while FiveThirtyEight required 3-5 days for new polls to register. The Biden dropout was the largest inflection point: Polymarket's swing-state Trump lead dropped ~6 percentage points in the settled window versus FiveThirtyEight's ~4-point shift over a longer horizon.
Performance Summary
| Metric | Polymarket | 538 | Interpretation |
|---|---|---|---|
| Sep 12 accuracy (13 states) | 84.6% | 61.5% | Markets led on final snapshot |
| Sep 12 accuracy (7 swing) | 71.4% | 28.6% | Largest gap in battlegrounds |
| Daily avg (Mar-May) | 63.6% | 99.4% | Polls led in stable period |
| Daily avg (Aug-Sep 12) | 79.2% | 62.2% | Markets led in volatile period |
| McNemar's p-value | -- | -- | p = 0.25; not significant (n = 13) |
| Event direction accuracy | 4/5 (80%) | 3/4 (75%) | Both strong; markets faster |
Conclusions
Polymarket produced more accurate state-level predictions on the final overlap date and in the volatile late-campaign period, while FiveThirtyEight was superior during stable early months. Neither source achieved statistical significance over the other due to the small 13-state overlap. In event response, both sources generally moved in the expected direction, but markets did so faster -- reflecting information within hours rather than the days required for new polls. The two methods are complementary: polls provide stable baselines when the race is settled, while markets signal shifts in real time when fundamentals change.
5. Future Work & Limitations
Limitations
The overlap window covers only 13 states and ends September 12 -- nearly two months before Election Day -- limiting statistical power. Our winner-call metric converts continuous signals into binary predictions, discarding calibration information. The forward-fill applied to FiveThirtyEight may disadvantage it during fast-moving periods. With only five events analyzed, event-response findings are indicative rather than conclusive. Finally, Polymarket's liquidity varies by state; thinly traded contracts may reflect abnormal bettor behavior.
Future Directions
Incorporating proper scoring rules (e.g., Brier scores) would better evaluate calibration. Extending the comparison to additional cycles would test whether the crossover pattern generalizes. Analyzing hourly Polymarket data could quantify reaction speed more precisely. A combined forecast could test whether a hybrid outperforms either signal alone.
6. References
Polymarket 2024 U.S. Election State Data. (2024). Kaggle.
https://www.kaggle.com/datasets/pbizil/polymarket-2024-us-election-state-data
FiveThirtyEight Presidential General Averages. (2024). GitHub.
https://github.com/fivethirtyeight/data/blob/master/polls/2024-averages/presidential_general_averages_2024-09-12_uncorrected.csv
Federal Election Commission. (2024). 2024 Presidential General Election Results.
https://www.fec.gov/documents/5645/2024presgeresults.xlsx
U.S. News & World Report. (2024). The Biggest Moments of the 2024 Presidential Election.
https://www.usnews.com/news/national-news/articles/2024-10-30/the-moments-that-defined-the-2024-presidential-election